
AUD/NZD Has a Bullish Structure with Confirmation
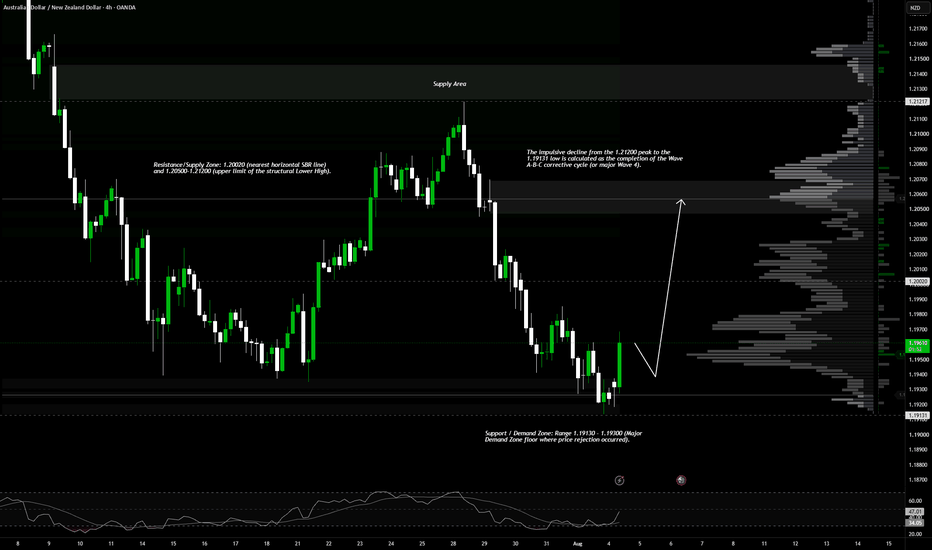
The H4 macro structure is moving within a wide Range Bound/Double Bottoming pattern.
The price recently fell through the previous low at 1.19300, hitting a low of 1.19131 (the bottom gray box). This sharp decline triggered a Liquidity Grab (a sweep of retail buyers' stop-losses), which was immediately responded to by impulsive buying (buying rejection), bringing the price back to 1.19599.
Current Price Action: The last H4 candlestick printed as a healthy green candle (impulse bullish candle) with a lower wick, confirming a Spring/False Breakout in the lower zone.
-------------------------------------------------------------------
✅ Key Zones:
- Resistance/Supply Zone: 1.20020 (nearest horizontal SBR line) and 1.20500-1.21200 (upper limit of the structural Lower High).
- Support / Demand Zone: Range 1.19130 - 1.19300 (Major Demand Zone floor where price rejection occurred).
---------------------------------------------------------------------
✅ Orderflow / Volume Profile Analysis (VPVR)
The Volume Profile histogram on the right side of the chart provides a highly precise mapping of liquidity:
- High Volume Node (HVN) / Nearest Orderflow Support:
A very thick volume spike is visible in the range of 1.19500 - 1.19700 (the current price area). The fact that the price managed to rebound quickly from the bottom (1.19131) and is now holding above this HVN level indicates the accumulation of institutional buy orders (buying absorption).
- Low Volume Node (LVN) / Upward Acceleration Zone:
Above 1.19750 and towards 1.20000, the volume distribution appears to thin (volume vacuum). If buyers are able to push the price through the 1.19750 level, the price is projected to accelerate rapidly through the LVN zone, pursuing the resistance target at the 1.20020 horizontal line.
---------------------------------------------------------------------
✅ Elliott Wave Analysis
Mapping the wave cycle movement on the H4 timeframe:
- Wave Structure: The impulsive decline from the 1.21200 peak to the 1.19131 low is calculated as the completion of the Wave A-B-C corrective cycle (or major Wave 4).
- Current Status: The impulsive surge upward from the 1.19131 floor to 1.19599 is identified as the beginning of the expansion of Wave 1 or micro Wave A of a new impulsive cycle.
- Projection: The price movement is projected to continue its impulsive upward push to test the nearest resistance target (1.20020), before undergoing a minor correction (Wave 2) and preparing to launch Wave 3 to a higher high.


