SOLUSDT Wedge breakout
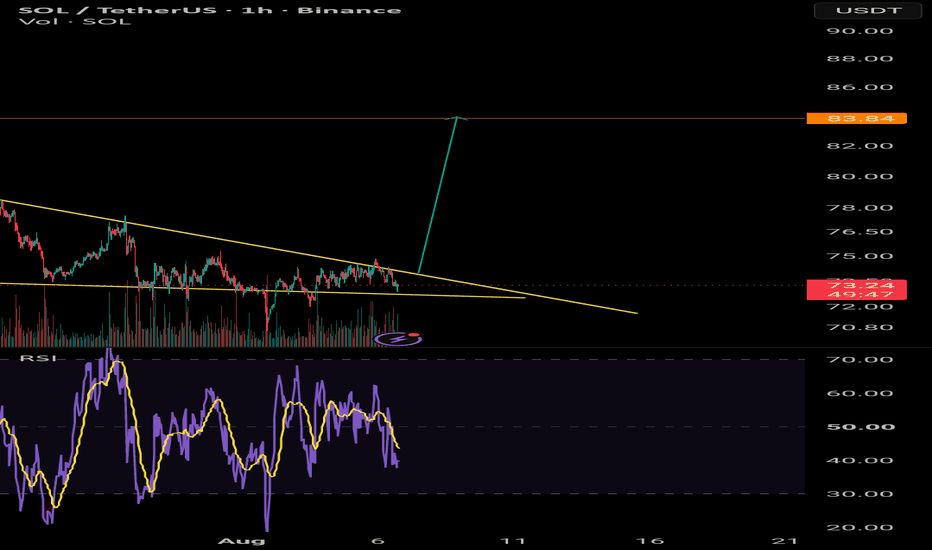
* Asset: Solana (SOL/USDT)
* Timeframe: 1-Hour Chart (Binance)
* Current Price: 73.26 USDT
* Target Resistance: 83.84 USDT
* Approximate Potential Increase: +14.4%
Chart Description & Trade Setup
* Pattern Recognition: SOL is currently consolidating within a classic falling wedge pattern on the 1-hour timeframe, marked by converging trendlines pushing price toward a tight apex.
* Breakout Projection: The chart displays an upward breakout arrow targeting the major resistance level near 83.84 USDT.
* Percentage Gain Calculation: Moving from the current breakout zone at 73.26 USDT up to the 83.84 USDT target represents an approximate price increase of 14.4%.
* Momentum Indicators: The RSI indicator is currently sitting in a neutral-to-bullish zone, leaving plenty of room for an explosive upward move upon confirmation of the trendline breakout.
> Disclaimer: Crypto trading carries high risk. Always manage your risk properly, use stop-losses, and conduct your own research before entering any positions.
>