Where Is Bitcoin’s Cycle Bottom? | The Golden Ratio
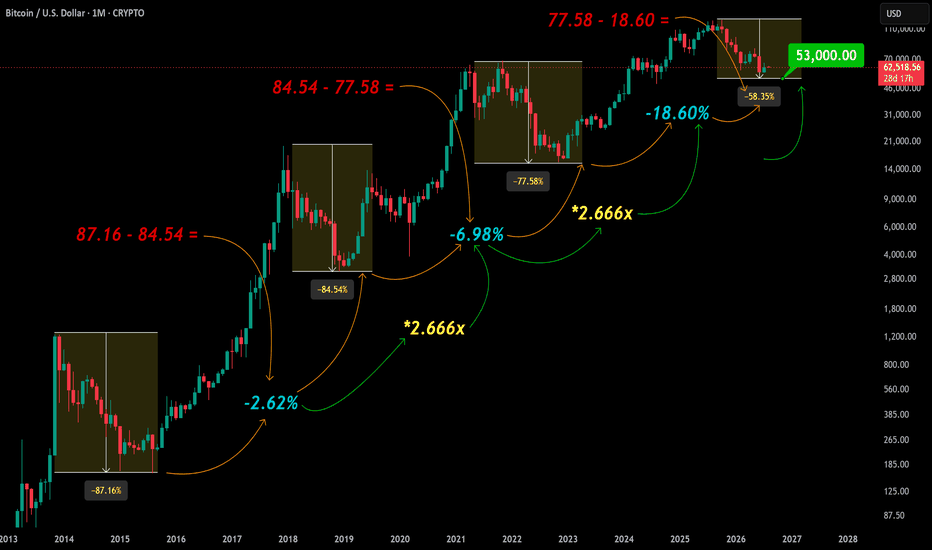
First, let’s discuss the idea behind this analysis.
We have examined several Bitcoin cycles, but please keep in mind that this entire framework could be wrong. We are simply testing a mathematical and fractal pattern. Interestingly, the number produced by this model is consistent with some of my other analyses, although I will not cover those in this analysis.
In the first Bitcoin cycle, the drawdown reached **87.16%**.
In the second cycle, the drawdown reached **84.54%**.
This means that the second cycle experienced a **2.62 percentage-point smaller drawdown** compared with the first cycle.
Now, let’s multiply this difference by a factor of **2.666**:
**2.62% × 2.666 = 6.98%**
Interestingly, this result matches the difference between the drawdowns of the second and third cycles. This suggests that the multiplier may be relevant to the pattern we are examining.
Now, let’s repeat the same process.
Using the same relationship, we arrive at approximately **18.60%**.
If we subtract this amount from the third-cycle drawdown, the model produces a projected fourth-cycle drawdown of approximately **-58.97%**.
Based on the previous cycle high, this would place Bitcoin’s potential bottom around **$53,000**.
I believe this ratio could potentially repeat again **if we do not encounter a major macroeconomic shock**, such as a severe recession, a global war, or a prolonged period of extremely high interest rates.
However, I do **not** want to present this as a certainty.
This is simply a **new perspective based on mathematical and fractal relationships between Bitcoin’s historical cycles**.
The purpose is not to predict the exact bottom with certainty, but rather to examine whether the historical relationship between cycle drawdowns can provide us with another potential area to watch.
This is not financial advice.
Sincerely,
Amir Ghasemi