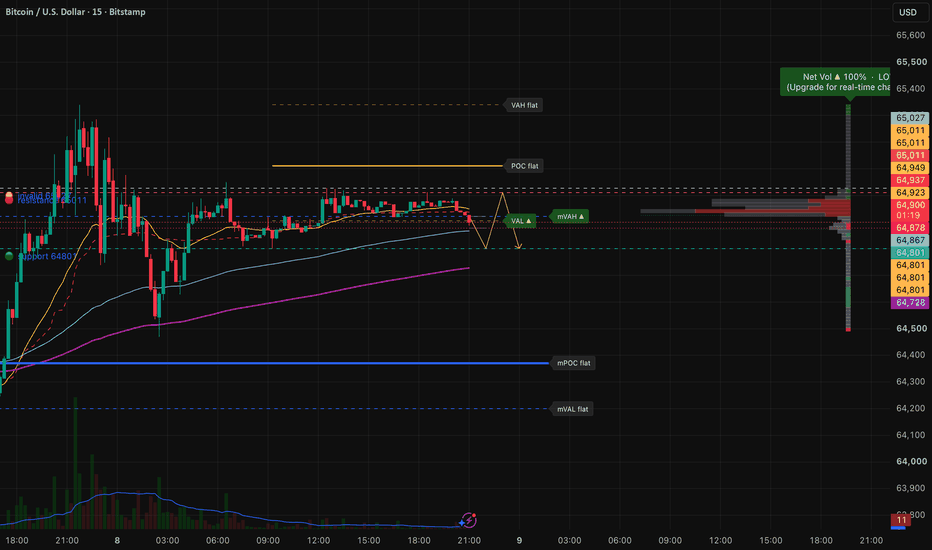
KenKem MVP — BTC US session scenario map (2026-08-08 12:00 UTC)
 BTCUSD
— US session read from my KenKem Master Volume Profile (MVP) indicator & strategy.
BTCUSD
— US session read from my KenKem Master Volume Profile (MVP) indicator & strategy.
CONTEXT
Read about 30 minutes before the US session open, on a Saturday tape — so this is crypto-only liquidity, and the indicator is flagging a LOW volume regime. Price has slipped just under the local value area low, with the master Point of Control and VWAP sitting as a lid immediately overhead. The last three hours span only ~$89 against roughly $870 across the full day, so momentum has gone flat rather than directional.
KEY ZONES
• Resistance / supply: 64,951, then 64,979 (value area high) and 65,011
• Support / demand: 64,913, then 64,801
• Point of Control (volume magnet): 64,938 master / 64,929 local
SCENARIOS (to watch — NOT signals)
📈 Bullish: reclaim 64,951 → room toward 64,979 then 65,011 (the medium-term EMA structure is still stacked upward and price holds above the slower EMAs).
📉 Bearish: lose 64,913 → opens 64,801, then the master value area low near 64,579 (price already sits below the local value area low, and the nodes around it read as net-sell).
↔️ Range/unclear: stuck 64,913–64,951 → stand aside until a decisive close; the two fast EMAs are within a couple of dollars of each other.
⛔ Invalidation: a close above 65,027 voids this map.
WHAT THE MVP TOOL IS SHOWING
The Master Volume Profile plots rolling value areas (VAH/VAL), the Point of Control, and a net-volume pressure read to locate where volume is building or drying up. Worth stating plainly: that net-volume verdict printed net-sell on the 15m frame and net-buy on the 5m frame within the same pass, and it is reading saturated — so I treat it as two-sided rather than as a direction. This idea is the qualitative output of that tool; the strategy's internal thresholds, gating and entry/exit logic are not disclosed.
Built with the KenKem Master Volume Profile indicator & strategy.
Technical analysis only, by KenKem's algorithm — NOT financial advice. Trade your own plan and manage your risk.