Friday Night Recap: Equities Explode & BTC Prepares for Battle
Title: Friday Night Recap: Equities Explode & BTC Prepares for Battle 💥📉
Welcome to our brand new "Friday Night Recap" section! We will be dedicating our Friday evenings to wrapping up the week's most critical market events and diving deep into Bitcoin's daily structure.
What a wild week it has been for traditional finance. U.S. equities went on an absolute tear today, adding a staggering $550 billion in market cap. This massive upside explosion and push toward new highs was heavily catalyzed by weak employment data, which drastically reduced the market's probabilities of further Fed rate hikes. Meanwhile, on the crypto fundamental front, institutional adoption remains the silent driver; despite the recent sideways chop, major Wall Street players continue to steadily accumulate via Spot ETFs, building a strong underlying bid for the long term.
📊 BTC Technical Analysis (1D Timeframe):
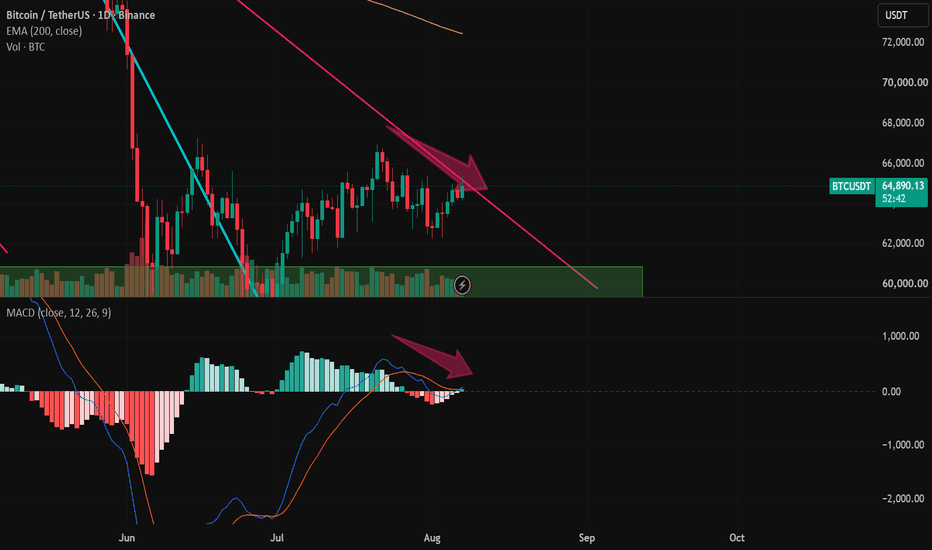
Looking at the Bitcoin daily chart, at first glance, we can clearly see that a definitive bearish Elliott Wave structure has come to an end. After topping out at the $125k/$126k macro highs in October of last year, BTC literally lost half of its value by February. The subsequent recovery attempt fought hard but was ultimately rejected at the $85k resistance zone. This area was particularly heavy, acting as former support where Wave 2 began, and was perfectly reinforced by the 200 EMA functioning as dynamic resistance.

So, where does that leave us lately? Since June, the price has been tightly trapped in a lateral consolidation range, bouncing between approximately $60k and $67k.
The short-term situation is critical: in the coming days, price action must confront Trendline C, and sitting immediately above it is the 200 EMA. These are two formidable, heavy walls to break. As we've seen historically, Bitcoin tends to highly respect the 200 EMA, making it much more than just a standard resistance level. Does this mean our bias should be strictly bearish? I wouldn't guarantee that. BTC is a natural destroyer of walls and has proven its ability to aggressively smash through heavy resistance countless times in the past. Oscillators like the MACD are perfectly reflecting this indecision, printing choppy zig-zags while the price dances to the same tune.
🤖 Quantitative & Options Analysis:
If we want to cut through the noise, our quant tools provide a crystal-clear explanation for this current price action:
Gamma Exposure (GEX): The GEX Heatmap classifies the current environment strictly as a "PINNING REGIME (Low Volatility)". The price is being suffocated between a Call Wall (+GEX Magnet) at $64,880.11 and a tightly squeezed Put Wall (-GEX Accelerator) at $64,183.40. The expected volatility state is officially "Suppressed," meaning market makers are actively hedging to pin the price exactly where it is right now.
Dynamic Monte Carlo Projections: Our statistical models perfectly corroborate this sideways chop. The 20-bar forecast shows a very slight estimated drift of +0.3% per bar (+15.1% annualized). The median target sits essentially flat at $65,670.48, offering a moderate upside probability of just 55.1%.
🎯 Conclusion & Strategy:
Both the classical technicals and the algorithmic models are screaming "indecision." If you ask me, the most prudent approach is patience. I would wait to see a decisive, high-volume break above Trendline C before even thinking about initiating new long positions. Until that wall falls, we must respect the consolidation.
Have a great weekend, traders! Let's see what next week brings. 🥂
⚠️ Disclaimer: This analysis is strictly for educational purposes and intended solely to intellectually enrich our trading community. It does NOT constitute financial or investment advice. Always perform your own research and strictly manage your risk.