ETH Next Volatility Window: Around August 12 (Aug. 11-13)
Ethereum / TetherUS BINANCE:ETHUSDT
Hello, traders.
Follow me to stay updated with the latest market analysis.
Wishing you successful trading.
============================================================
■ ETH VOLATILITY WINDOW: AROUND AUGUST 12

Following the end of BTC's short-term volatility cycle,
the next major volatility window to watch is ETH.
Expected volatility window:
▶ Around August 12
▶ Estimated range: August 11-13
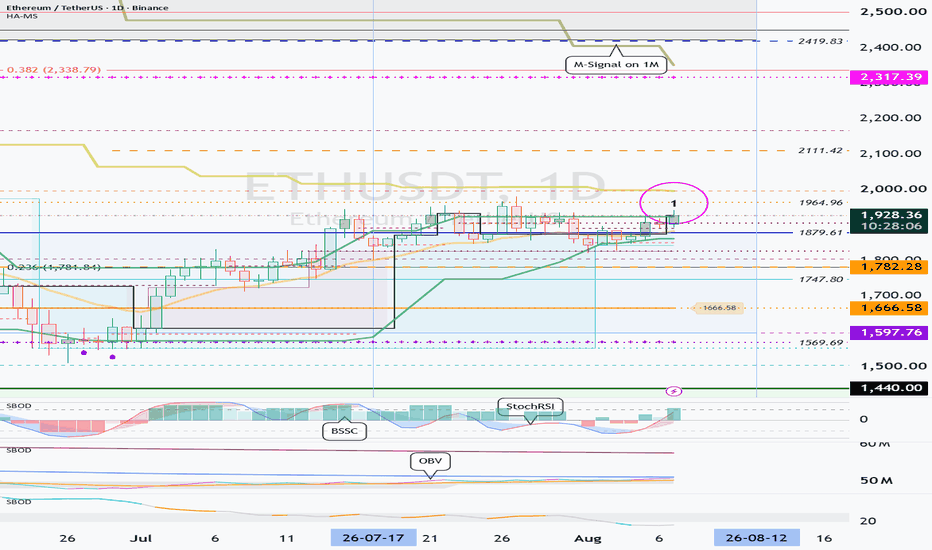
ETH is currently attempting to rebound from its lower price zone.
However, for this move to develop beyond a simple technical rebound
and turn into a meaningful bullish trend reversal, ETH needs to:
▶ Break above 1964.96
▶ Hold above 1964.96
The reason is that ETH has been forming a
"step-down" bearish structure.
To confirm that this step-down structure is ending,
price needs to recover above the previous HA-Low
and successfully hold that level as support.
In other words:
Break above 1964.96
↓
Hold above the level
↓
Recover the previous HA-Low
↓
Step-down structure begins to weaken
↓
Probability of a bullish trend reversal increases
============================================================
■ HA-Low / HA-High: PRIMARY TRADING LEVELS
==========================================
The most important indicators used for actual trade execution
on this chart are:
▶ HA-Low
▶ HA-High
The following indicators are used as confirmation tools:
▶ StochRSI
▶ OBV
▶ BSSC
The basic concept is simple.
HA-Low / HA-High
→ "Where should I trade?"
StochRSI / OBV / BSSC
→ "Are the conditions strong enough to actually take the trade?"
Therefore, I do not buy simply because StochRSI is oversold,
nor do I automatically sell because StochRSI is overbought.
The first step is to determine where price is located
relative to HA-Low and HA-High.
---
## ▶ HA-Low
HA-Low represents a potential LOW ZONE.
When price approaches HA-Low and successfully finds support,
the area may become a potential BUY ZONE.
---
## ▶ HA-High
HA-High represents a potential HIGH ZONE.
When price approaches HA-High and gets rejected,
the area may become a potential SELL / PROFIT-TAKING ZONE.
However, because HA-Low and HA-High are displayed as single lines,
it can sometimes be difficult to identify the broader low
and high zones for actual trading.
============================================================
■ DOM(-60) / DOM(60): DEFINING LOW & HIGH ZONES
===============================================
To solve this issue, I developed:
▶ DOM(-60)
▶ DOM(60)
Represents a potential LOW ZONE.
Used together with HA-Low to identify
potential accumulation and buy areas.
Represents a potential HIGH ZONE.
Used together with HA-High to identify
potential profit-taking areas.
Therefore, actual trading decisions can be based on:
HA-Low
DOM(-60)
HA-High
DOM(60)
The overall structure can be summarized as follows:
DOM(-60) / HA-Low
↓
LOW ZONE
↓
Potential accumulation / buy zone
HA-High / DOM(60)
↓
HIGH ZONE
↓
Profit protection / scale-out zone
============================================================
■ STRATEGY WHEN HA-Low FAILS
============================
If price fails to hold HA-Low and moves lower,
a step-down bearish structure may continue.
However, a break below HA-Low does not necessarily mean
that the entire position should immediately be closed.
A prolonged step-down structure will eventually form
a new bottoming area and attempt a bullish reversal.
Therefore, the key response to an HA-Low breakdown is not:
"Sell 100%"
but rather:
"Secure liquidity through partial position management."
---
##
HA-Low support fails
↓
Partially reduce the position
↓
Increase cash reserves
↓
Monitor the next decline
↓
Price approaches a new DOM(-60) / HA-Low
↓
Check for support
↓
Rebuy the amount previously sold
↓
Add to the position after support is confirmed
This strategy allows traders to maintain liquidity
during a declining market while adjusting their average entry price
and gradually increasing the total position size.
============================================================
■ STRATEGY WHEN HA-High BREAKS
==============================
On the other hand,
if price breaks above HA-High and continues higher,
a step-up bullish structure may begin to develop.
However, a step-up structure will eventually form a high
and transition into a corrective phase.
Therefore, positions accumulated around
HA-Low or DOM(-60) should gradually focus on:
▶ Scaling out
▶ Taking profits
▶ Protecting profits
as price approaches HA-High or DOM(60).
---
##
Price approaches HA-High / DOM(60)
↓
Step 1: Scale out part of the core position
↓
Lock in profits
↓
Check whether HA-High converts into support
↓
Support confirmed + bullish momentum continues
↓
Day-trading opportunity
There is one important point.
HA-High fundamentally represents a HIGH ZONE.
Therefore, even if price breaks above HA-High,
holds it as support and continues higher,
a new position opened in this area should not be treated
the same way as a core position accumulated near HA-Low.
Instead, it should be treated as a:
"Short-term / Day-Trading Position"
Any trade entered around HA-High must have:
▶ A clearly defined stop-loss level.
If a reasonable stop-loss level cannot be determined,
▶ The day trade should NOT be taken.
The reason is simple:
HA-High represents a potential high-price zone.
============================================================
■ CURRENT ETH PRICE STRUCTURE
=============================
ETH is currently moving higher from the important range of:
▶ 1597.76 - 1879.61
and is attempting to challenge:
▶ 1964.96
The supporting indicators are currently showing
somewhat different signals.
---
##
StochRSI is approaching the overbought zone.
This increases the possibility of:
▶ Weakening short-term momentum
▶ A short-term pullback
▶ Sideways consolidation to reset the indicator
---
##
On the other hand,
OBV has moved above the High Line,
indicating strong buying pressure.
Therefore, the key question for ETH is:
"Can this buying pressure be sustained?"
If OBV remains above the High Line
while price holds above 1879.61,
ETH may be able to reset its overbought StochRSI
without experiencing a significant price decline.
In other words, we could see:
"Time-based consolidation rather than a deep price correction."
The ideal bullish structure would be:
OBV remains above High Line
+
Price holds above 1879.61
+
StochRSI resets
↓
Another attempt to break 1964.96
↓
Breakout above 1964.96
↓
1964.96 converts into support
↓
Probability of a bullish trend reversal increases
Strong buying pressure could also push ETH directly above 1964.96
without a meaningful correction.
However, if StochRSI enters the overbought zone
and buying pressure begins to weaken at the same time,
upside momentum may become limited
and another short-term pullback could follow.
============================================================
■ AUGUST 12: TWO KEY PRICE LEVELS TO WATCH
==========================================
Considering the current price structure
and the relationship between:
HA-Low / HA-High
DOM(-60) / DOM(60)
StochRSI / OBV / BSSC
the location of ETH during the next volatility window
will be extremely important.
Next volatility window:
▶ Around August 12
▶ August 11-13
The two most important price levels are:
▶ 1782.28
▶ 1964.96
---
## PRICE NEAR OR ABOVE 1964.96
Break above 1964.96
↓
Hold above 1964.96
↓
Previous HA-Low recovered
↓
Step-down bearish structure weakens
↓
Probability of a bullish trend reversal increases
---
## PRICE NEAR 1782.28
Failure to break 1964.96
↓
Price correction
↓
Test support around 1782.28
↓
Determine the next directional move
============================================================
■ FINAL CHECKPOINT
==================
Next volatility window:
▶ Around August 12
▶ August 11-13
Key price levels:
▶ 1782.28
▶ 1879.61
▶ 1964.96
Key factors to monitor:
▶ Breakout and support above 1964.96
▶ Ability to hold above 1879.61
▶ OBV holding above the High Line
▶ StochRSI reset after entering the overbought zone
▶ Support around HA-Low / DOM(-60)
Ultimately, the key question during this volatility window
is not simply:
"Can ETH break above 1964.96?"
The more important question is:
"Can ETH break above 1964.96 and HOLD above it?"
If ETH successfully breaks above 1964.96
and converts the level into support,
the probability of transitioning out of the current
step-down bearish structure will increase significantly.
On the other hand,
if the breakout fails,
the next important factor will be whether ETH
can establish support around 1782.28.
Therefore, August 11-13 may become
an important volatility window for determining
ETH's next major directional move.
============================================================
Thank you for reading.
Wishing you successful trading.