BTCUSD: How this Pattern Could Prevent a Total Meltdown!

Hello There,
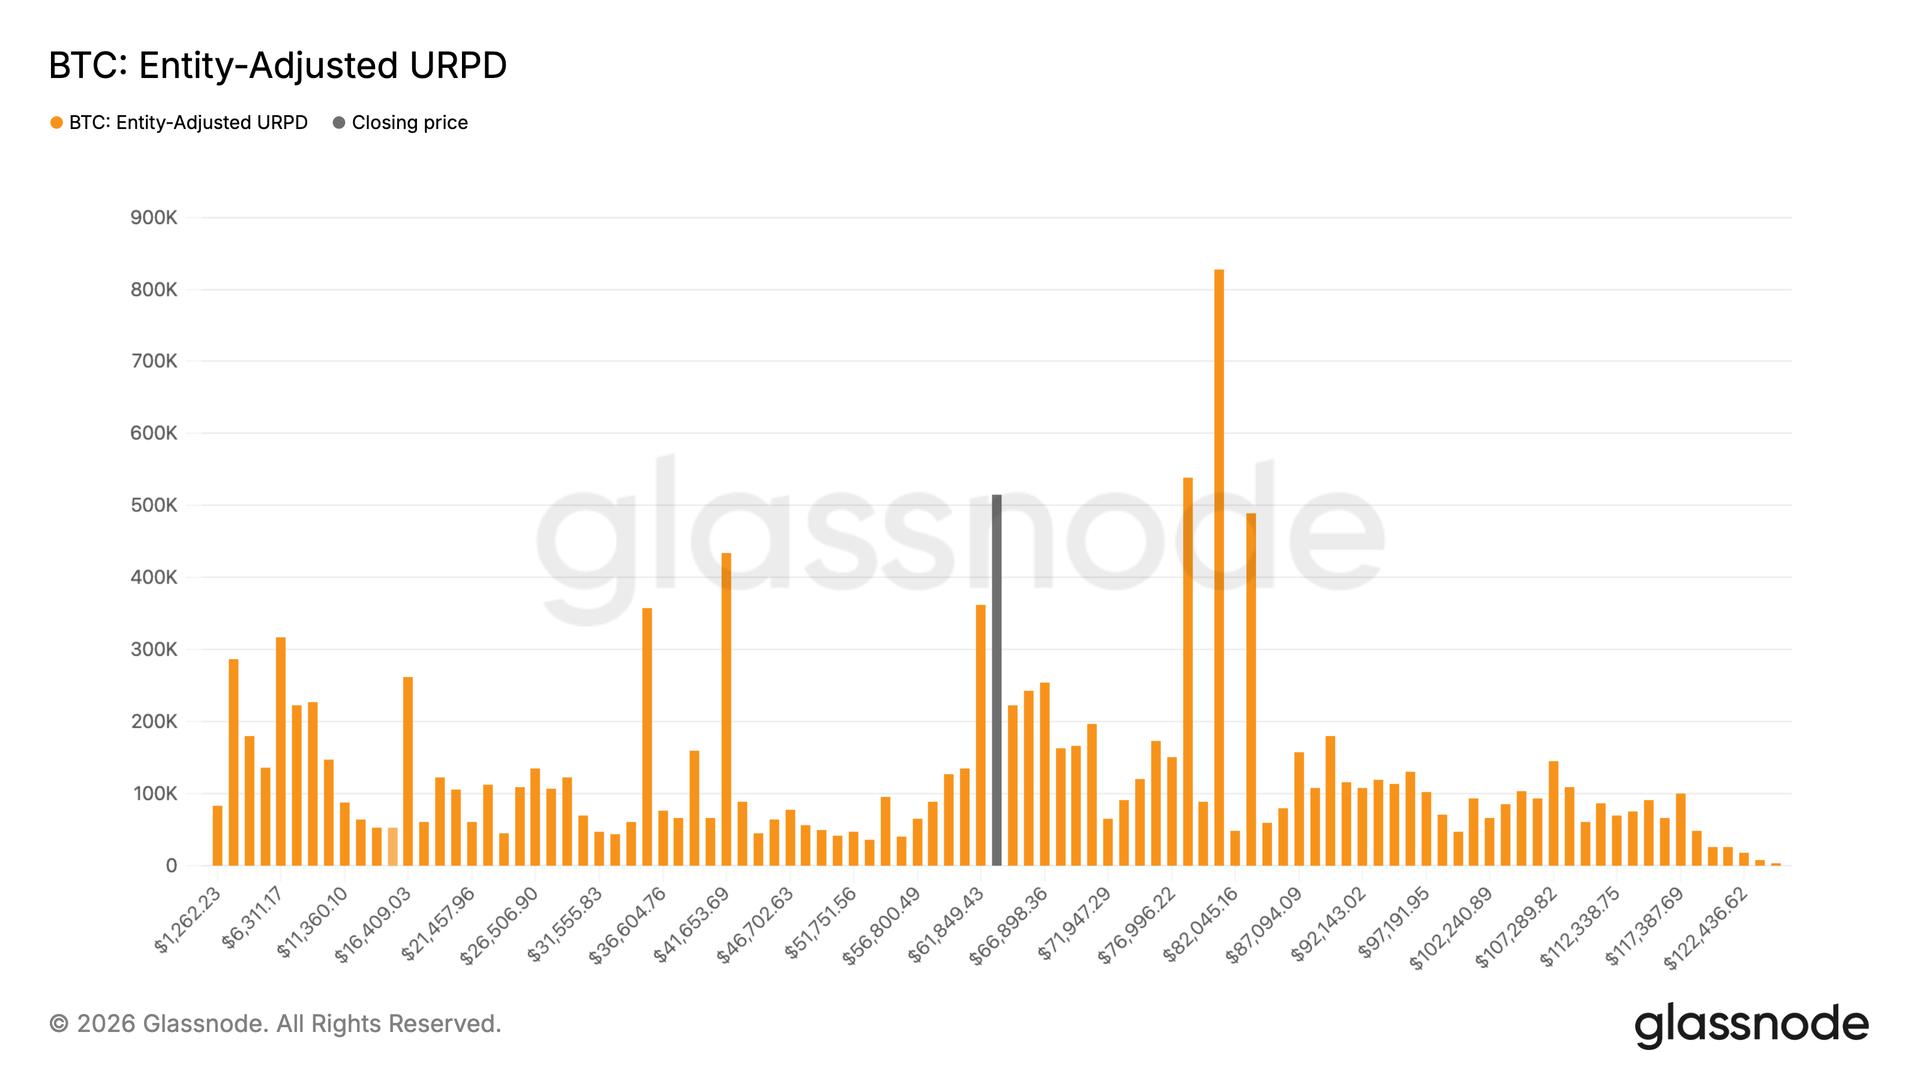
welcome to my new analysis about BTCUSD from a weekly timeframe perspective. BTCUSD in the past weeks and months experienced heavy meltdowns, massive price declines, and increased volatility, with smart money market operators dumping their shares onto the market. Now there is still supply remaining, which should not be underestimated. Only some movements from big wallets dumping their holdings could cause the price to drop enormously.
Therefore, BTCUSD is still in a very crucial state in which a bearish price increase could lead to BTCUSD visiting risky low levels. Especially when considering the pattern that BTCUSD is forming over the past price movements. BTCUSD formed several bear flags with massive breakdowns towards the downside. BTCUSD already completed two bear flags within the past weeks. Usually, such patterns evolve into three bear flags in a row. Now BTCUSD is already forming the third one.
It is not unlikely that this next bear flag completes within the upcoming time, setting BTCUSD up for the next major bearish move. Once this formation has been completed, as seen in my chart, BTCUSD is likely to test the remaining zones as marked in my chart first. This will be a highly crucial dynamic because it will determine if BTCUSD drops further or manages to somehow reverse within the structure.
In any case, the completion of the bear flag formation within the upcoming times is highly likely. It will be highly important then how BTCUSD approaches the lower zones. If BTCUSD should increase momentum so heavily that it drops below the crucial zone, into the bearish drop continuation range, marked in red in my chart, this will cause the bearish dynamic to continue towards the downside. At the moment, this scenario should not be underestimated.
Considering the scenario in which BTCUSD holds the lower levels and manages to bounce within this area, as it is marked in my chart, a completion of this gigantic pattern could activate the initial target zones as marked in my chart. From there on BTCUSD has the ability to visit the upper levels again which will lead to a potential trade on the long side with considerable profit potential on the long side.
Next time, it will be highly decisive to watch how BTCUSD completes this bear flag and approaches the mentioned zones. I will also watch out for massive wallet movements, which could point the price into the bearish direction more heavily. It will be a highly decisive phase in which BTCUSD will move into, so I am going to consider any meaningful updates in this regard.
In this manner, thank you a lot for watching!
The support is highly appreciated.
VP