BTC/USDC — 1H Market Structure Analysis
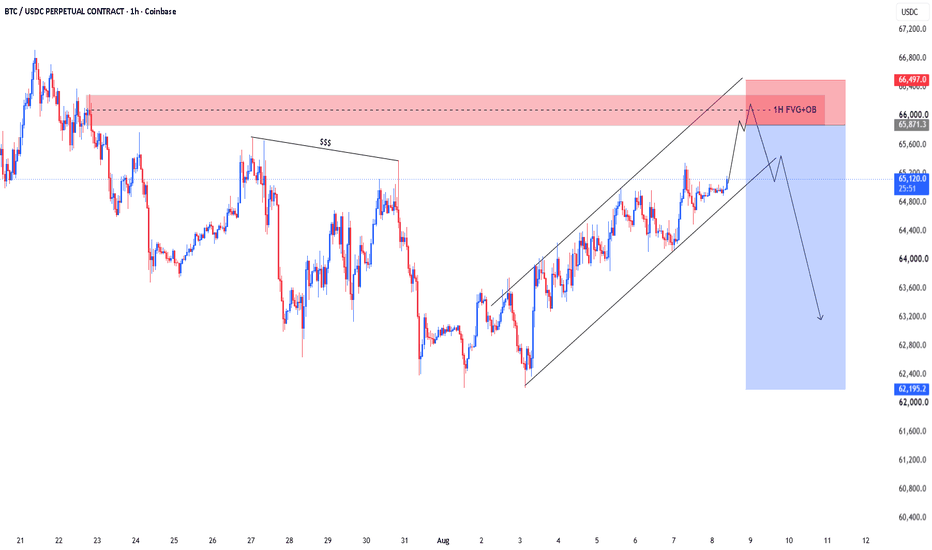
BTC/USDC is currently trading around 65,096 and remains within a clearly defined ascending structure on the 1H chart. Price has been forming higher highs and higher lows, suggesting short-term bullish momentum.
🔍 Key Technical Areas
Ascending structure: Price is respecting the rising trend/channel from the early-August low.
Liquidity / resistance: The 65,800–66,300 area is an important overhead zone where previous price activity and liquidity may become relevant.
1H FVG + OB: The marked 1H Fair Value Gap + Order Block around 65,800–66,300 represents an area worth observing for the market's reaction.
Upside liquidity: A move into the upper zone could potentially sweep nearby highs before a meaningful reaction develops.
Downside structure: If price loses the ascending structure and confirms a bearish break, the next areas of interest are progressively lower, with the chart highlighting the 63,200–62,200 region.
🧠 Scenario-Based View
Bullish scenario:
Price continues respecting the rising structure and trades into the marked 1H FVG/OB. A strong acceptance above the zone would weaken the bearish-reaction thesis.
Bearish reaction scenario:
If price reaches the marked supply area and shows rejection, displacement, and a confirmed lower-timeframe structure shift, a deeper retracement toward the lower liquidity areas becomes technically plausible.
Invalidation / Risk:
The bearish reaction idea becomes less relevant if price accepts and holds above the marked 1H FVG + OB, rather than simply wicking into it.
Important: This is a technical/educational market-structure analysis, not financial advice or a trade recommendation. Market conditions can change rapidly; always conduct your own research and manage risk appropriately.
Trading View Title
BTC/USDC 1H: Ascending Structure Meets 1H FVG + Order Block
Tags:
#BTC #Bitcoin #BTCUSDC #MarketStructure #SMC #FVG #OrderBlock #TechnicalAnalysis #PriceAction #TradingEducation