BTC - Re-examining Key Trendline & Structure
Bitcoin / TetherUS BINANCE:BTCUSDT
I recently made a post outlining the major retest occurring for ETH:

In that idea I outlined how ETH was breaking out of a significant structure that had been forming since October 2025. I also pointed out that BTC had a similar structure that had already played out, and that is exactly what this post will focus on.
The Bitcoin Trendline
I outlined this key trendline for Bitcoin many times throughout March 2026, but you can see it most clearly in this idea:
Bitcoin has shown more strength than altcoins throughout the entire last bull market and continues to do so now. Because of this, Bitcoin broke out of its structure back in March 2026, well ahead of ETH, which only saw its breakout occur in July 2026.
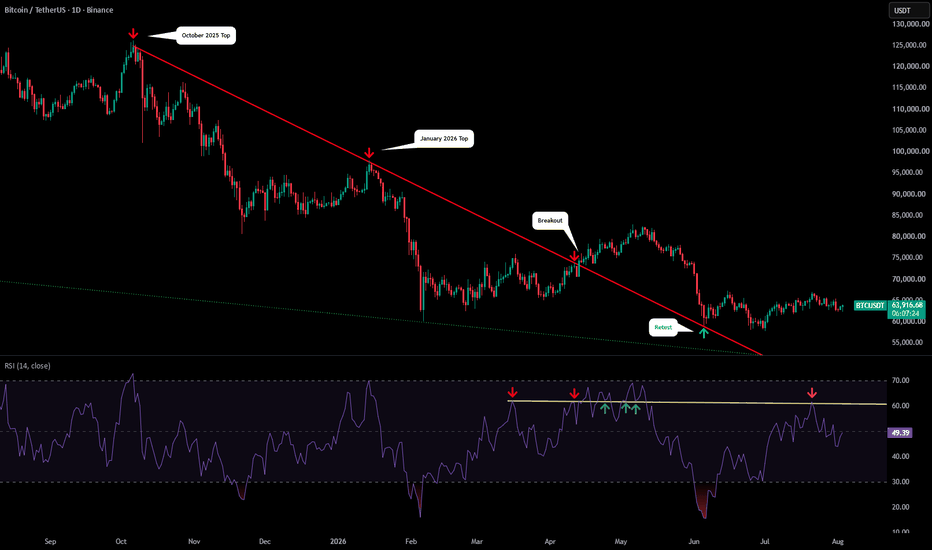
One important thing to mention is that I slightly changed the angle of this trendline between my last idea (March 2026) and this current one. Instead of drawing it from the wick highs in (October 2025) to candle bodies (March 2026), I flipped it to candle bodies (October 2025) to wick highs (March 2026), which gives a more accurate reading.
Viewing it this way, you can see Bitcoin broke above this key trendline in March 2026 and saw a strong 13% rally following the breakout, leading to its next pivot high in May 2026 (also aligning with ETH's rejection at its own trendline that same month).
Bitcoin then saw a 28% decline over the following month from its May 2026 pivot high. But where the next major pivot low formed is the part worth highlighting.
The key trendline that had acted as major highs three separate times before the breakout ended up marking the major low around $59,000 in June 2026 before Bitcoin rallied significantly toward $67,000.
Why This Matters for ETH
Since ETH has shown even more compression and confluence at its own key trendline compared to what Bitcoin showed at its equivalent level, it becomes even more important right now to be watching ETH at this trendline than it was watching BTC back in March and June.
I wanted to give you this side-by-side comparison so the ETH idea makes even more sense in context.
One final note for Bitcoin is the confluence the RSI has seen around the 62 level (yellow ray). It has marked many highs (red arrows) and lows (green arrows) so once trend momentum breaks back above will be a clear indication of the next expansion phase.