BTC 15M: Weak-High Liquidity Caps Price | Key SMC Decision Zone
Market Thesis:
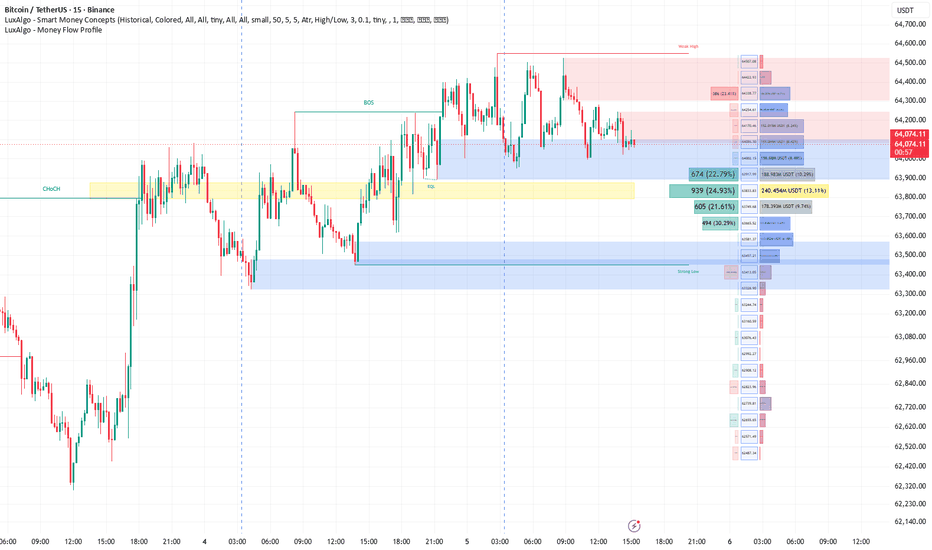
BTC/USDT retains a bullish external structure after the visible CHoCH around 63,800–63,834 and subsequent BOS through 64,254.61. However, price is currently balancing near 64,090 beneath two red resistance zones, indicating short-term corrective order flow.
Buyers retain structural control above 63,917.99, while sustained acceptance below that level would expose the EQL liquidity band and deeper support.
Visible Confluences — 15-Minute Chart:
Bullish CHoCH: approximately 63,800–63,834.
Bullish BOS: approximately 64,254.61.
Weak High liquidity: approximately 64,550.
Upper red resistance zone: 64,338.77–64,507.08.
Immediate red resistance zone: 64,086.30–64,254.61.
Blue support zone: 63,917.99–64,086.30.
EQL liquidity band: approximately 63,800–63,880.
Major Money Flow Profile node: 63,833.83, displaying 240.454M USDT and 13.11% of the visible profile.
Additional profile support: 63,917.99 and 64,002.15.
Additional profile resistance: 64,170.46 and 64,254.61.
Deeper blue support zone: 63,328.90–63,581.37.
Strong Low: approximately 63,450.
No Order Block or FVG label is visibly plotted, so neither is incorporated into this analysis.
Trade Scenarios:
Setup 1: Sell the Immediate Resistance
Direction: Sell
Entry Zone: 64,170.46–64,254.61
Required Trigger: Rejection or liquidity sweep inside the zone, followed by a 1–5 minute bearish CHoCH or decisive momentum close back below 64,170.46.
Stop Loss: 64,338.77
TP1: 64,086.30
TP2: 64,002.15
TP3: 63,917.99
This is the primary short-term mean-reversion setup while the 15-minute BOS level remains resistance.
Setup 2: Buy the Blue Support Reclaim
Direction: Buy
Entry Zone: 63,917.99–64,002.15
Required Trigger: Sweep into the blue support zone, followed by a bullish LTF CHoCH and reclaim of 64,002.15.
Stop Loss: 63,749.68
TP1: 64,086.30
TP2: 64,170.46
TP3: 64,254.61
The setup is invalid without a confirmed reclaim. Sustained trading below 63,917.99 increases the probability of a move into the EQL band.
Setup 3: Sell the Weak-High Liquidity Sweep
Direction: Sell
Entry Zone: 64,338.77–64,507.08
Required Trigger: Price trades into the upper red zone, sweeps toward the weak high, then closes back below 64,507.08 with a bearish LTF structural shift.
Stop Loss: 64,575.00
TP1: 64,254.61
TP2: 64,170.46
TP3: 64,086.30
This is the higher-premium short scenario and should only be executed after visible rejection—not through a blind limit order.
Refinement Tip:
Use the 15-minute chart as the higher-timeframe reference map and refine execution on the 1-minute, 3-minute, or 5-minute chart. Prioritize liquidity interaction, LTF CHoCH, displacement or momentum candles, and a controlled retest before entry.
⚠️ Disclaimer:
Trading financial markets involves substantial risk, and no technical framework can guarantee an outcome. This analysis reflects the structure and probabilities visible in the supplied chart snapshot only; it is strictly educational and analytical, not personalized financial advice. Apply independent judgment, predefined invalidation levels, and disciplined risk management.