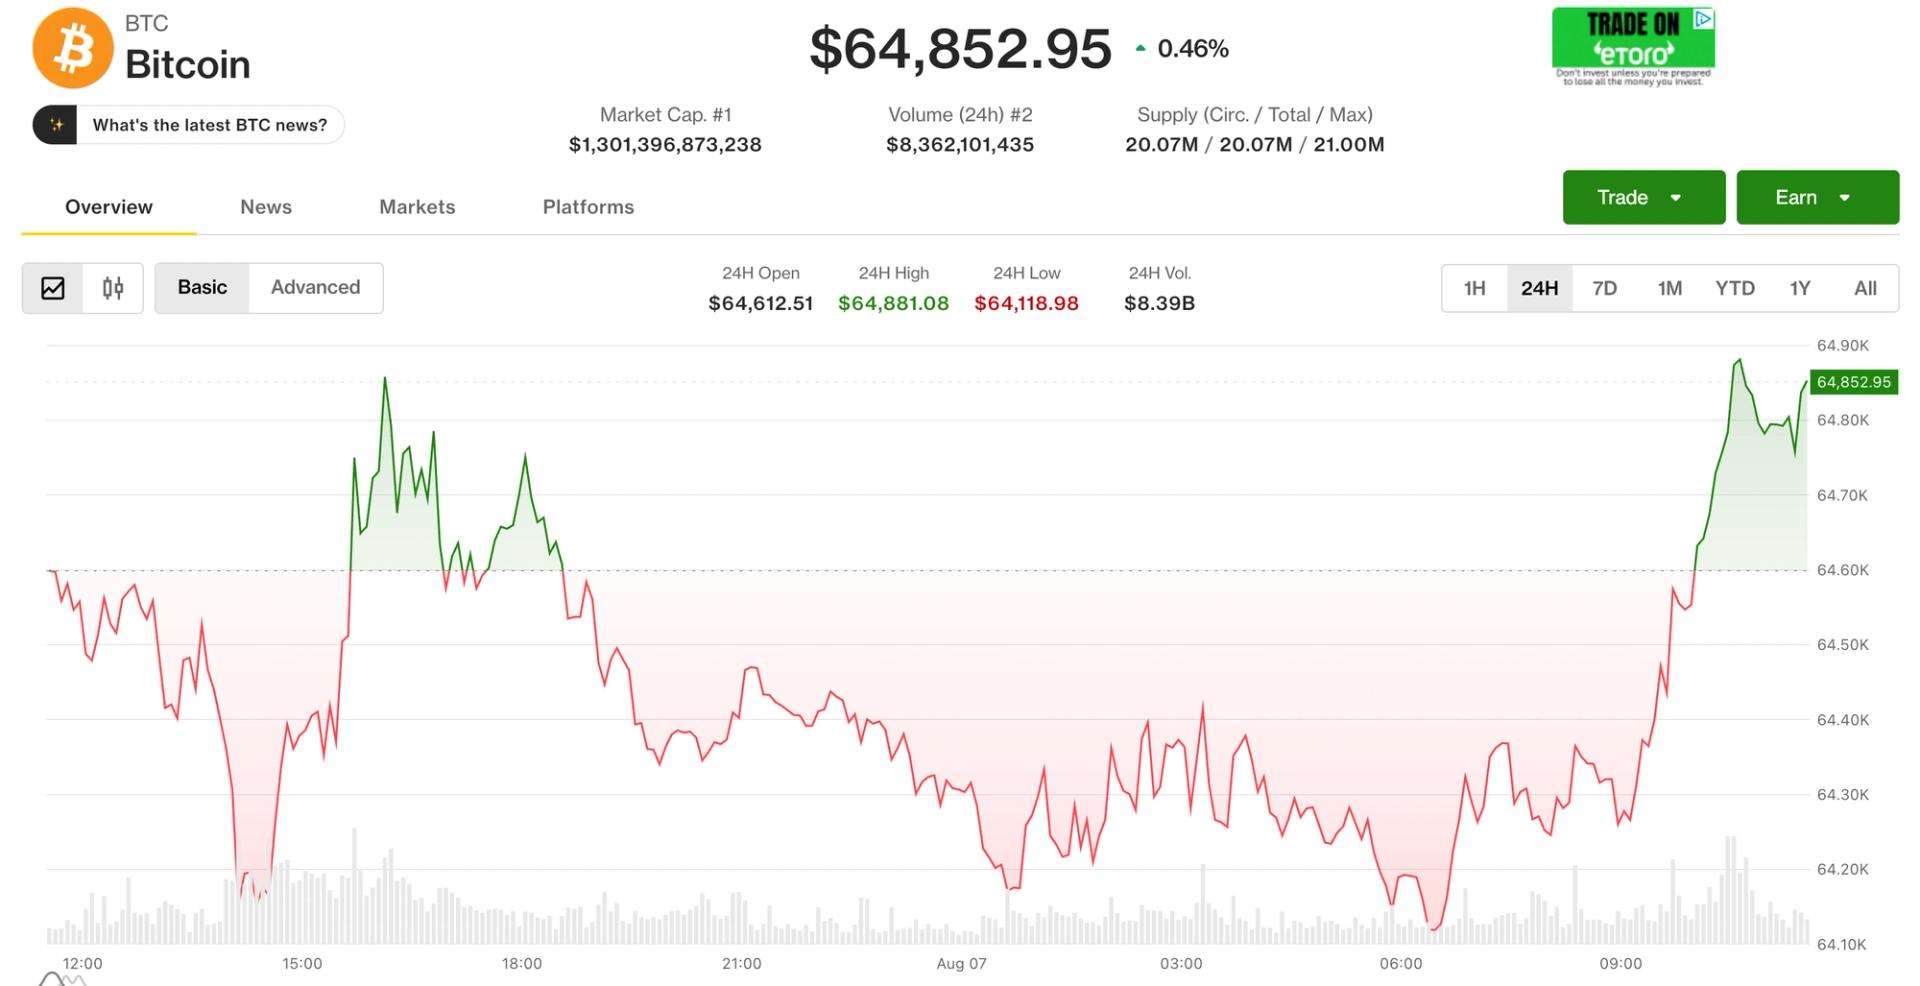
AUGUST 7 Bitcoin chart analysis
BTCUSD Perpetual Contract BYBIT:BTCUSD.P

Hello
It's a Bitcoin Guide.
My analysis is optimized for TradingView.
If you press the Replay button, you can check real-time movements.

This is the Bitcoin 30-minute chart.
On the left, indicated by the purple finger, I have connected the strategy exactly to the entry point of the long position entered on August 6th, which was $64,445.1.
*Chase buy long position strategy following the red finger's movement path
1) Chase buy at $64,755.9 / Stop loss if broken below the green support line
2) $66,193.7 long position 1st target -> Miracle final target price by the weekend
- If it breaks through the Miracle level, an uptrend will begin starting next week.
- For those maintaining long positions at 64.4K, the green support line stop loss remains the same.
- 65.9K is a zone to utilize for re-entering long positions.
From the point of breaking below the green support line, the price may fall to the Bottom -> Zone 1 indicated at the bottom.
Please use my analysis merely as a reference and for practical purposes.
I hope you operate safely by strictly adhering to trading principles and stop-loss orders.
Thank you.