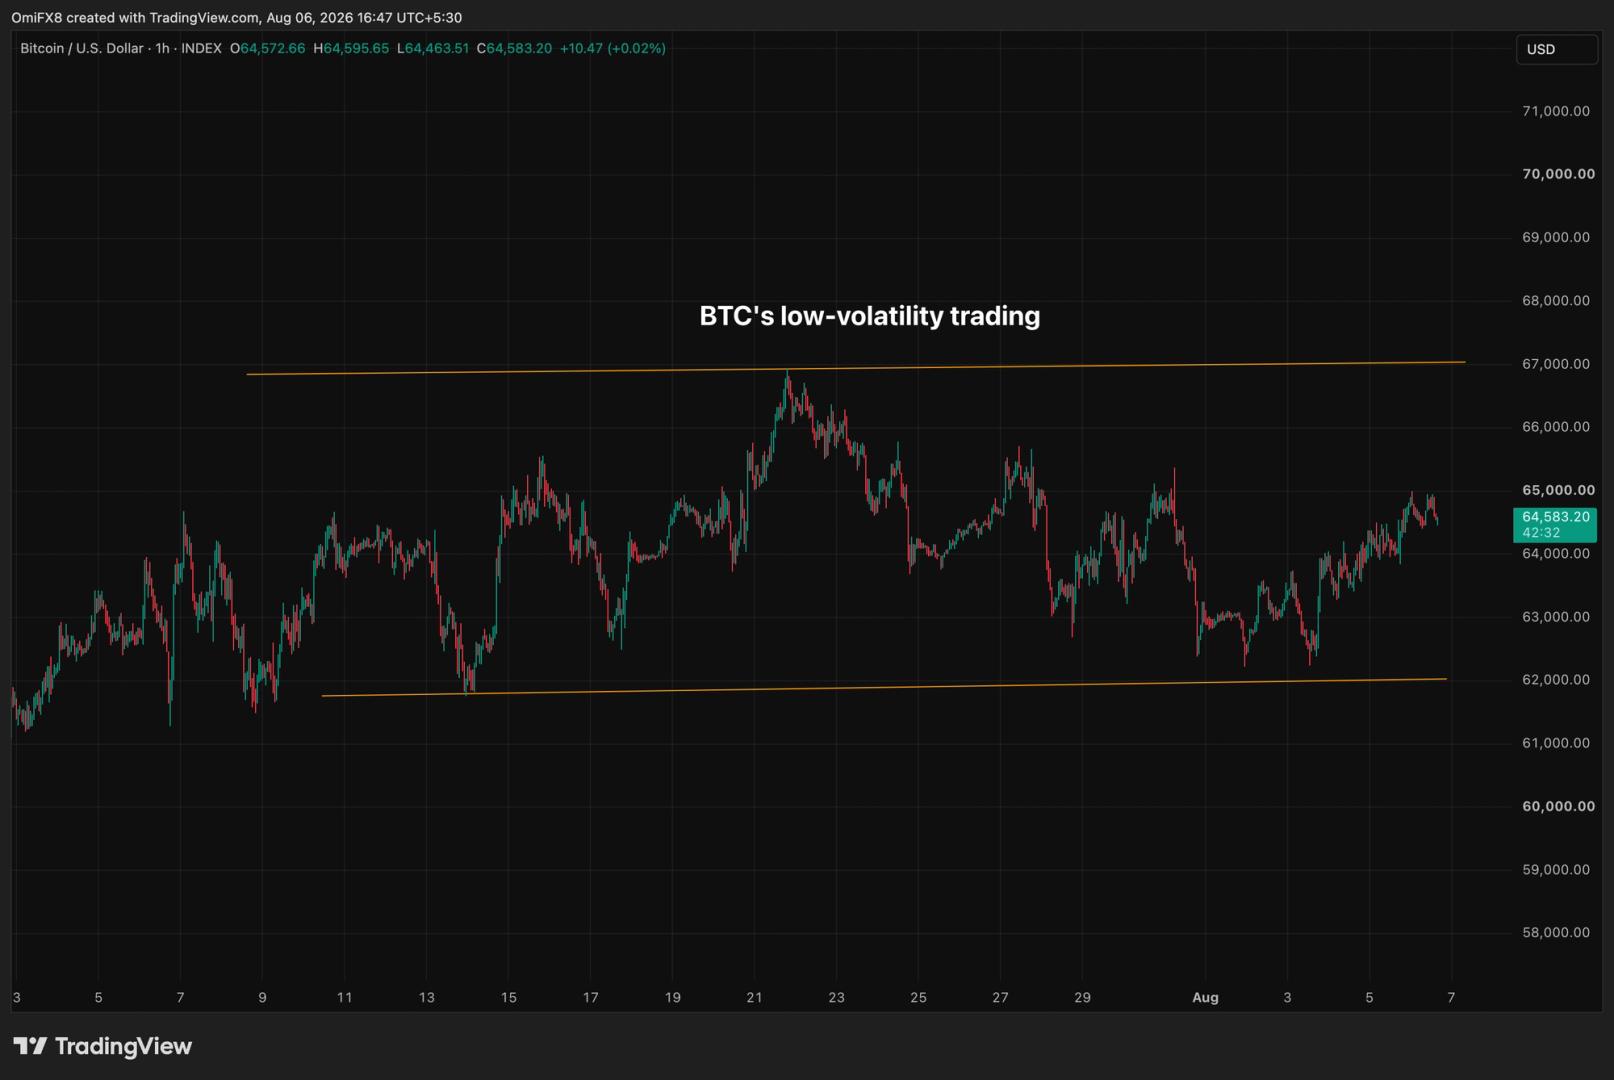
AUGUST 6 Bitcoin chart analysis
BTCUSD Perpetual Contract BYBIT:BTCUSD.P

Hello
It's a Bitcoin Guide.
My analysis is optimized for TradingView.
If you press the Replay button, you can check real-time movements.

This is the Bitcoin 30-minute chart.
In the bottom left, marked in turquoise, the strategy was maintained after entering the long position at $63,986.3 on August 5th.
*The strategy was maintained as is. *Long Position Strategy Before and After Touching Zone 1 (Purple Finger) at the Top
1) Purple Finger Zone 1: 64.8K Short Position Entry Zone
/ Stop Loss upon breaking the orange resistance line
2) Switch to Long Position at $64445.1 / Stop Loss upon breaking the purple support line
3) $65106.7 Long Position 1st Target -> Top 2nd Target Price
- If the strategy is successful, Zone 1 serves as a re-entry zone for the Long Position.
4) If the price fails to touch Zone 1 (Purple Finger) at the top and drops immediately:
Red Finger Zone 2 (Red Finger) at the bottom: $64049 Long Position Entry Zone / Stop Loss upon breaking the green support line
- The stop loss is the same for those currently holding a Long Position at 63.9K.
- Please be cautious, as the possibility of falling to the 3rd zone is open if the bottom zone is broken.
Please pay close attention to the real-time movements of the NASDAQ.
(Gold is surging on its own.)
Please use my analysis post merely as a reference and for practical purposes.
I hope you operate safely by adhering to trading principles and strictly using stop-loss orders.
Thank you.