AUGUST 4 Bitcoin chart analysis
BTCUSD Perpetual Contract BYBIT:BTCUSD.P
Hello
It's a Bitcoin Guide.
My analysis is optimized for TradingView.
If you press the Replay button, you can check real-time movements.

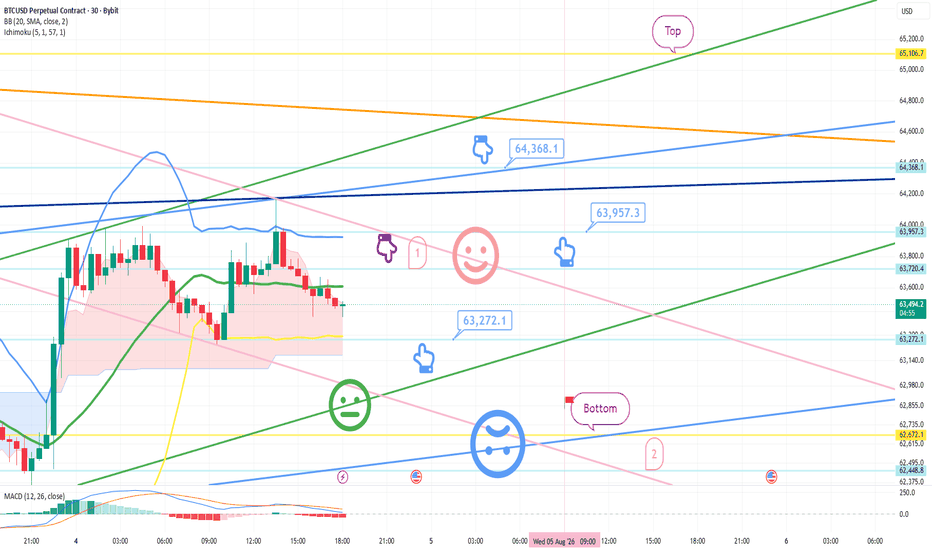
This is the Bitcoin 30-minute chart.
*Two-way Neutral Strategy around the time the purple finger touches Zone 1 at the top
1) After confirming the touch of Zone 1,
63,272.1 USD is the entry point for a long position / Stop loss if the green support line is broken.
2) 64,368.1 USD is the 1st target for a long position -> Top is the 2nd target price.
63.9K is the zone to utilize for re-entering the long position.
3) If the price drops immediately without touching Zone 1 at the top,
The Bottom zone at the bottom is the final waiting zone for a long position / Stop loss if the light blue support line is broken.
From the point where the light blue support line is broken, the path is open up to Zone 2.
Please use my analysis post only as a reference and for practical application.
I hope you operate safely by strictly adhering to trading principles and using stop loss settings as a necessity.
Thank you.